Sugarloaf Basecamp
Weather and snowfall

When is the best time to ski Sugarloaf? A weather guide built from the record

January is the strongest all-around bet. February is the most dependable powder month in the recent record. March has the widest range—from thaw to deep reset—and April is a spring-skiing decision, not a snow-total contest.

11 min readUpdated August 9, 2026By Sugarloaf Basecamp
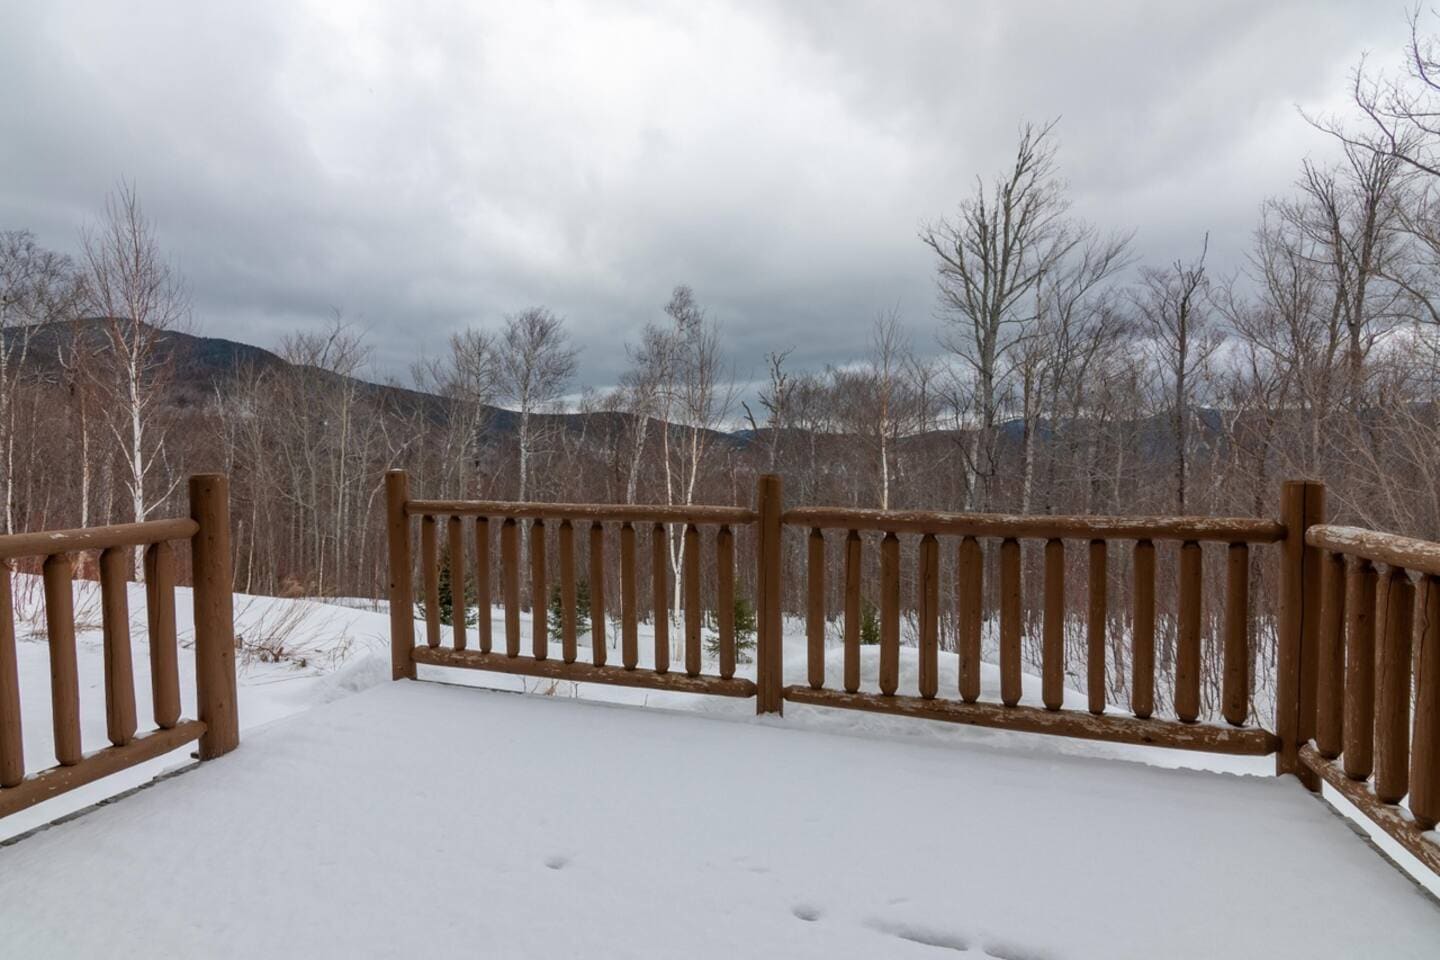
Fresh snow on a townhouse deck in Carrabassett Valley
A storm at the base is only part of the story; summit wind and temperature determine the ski day.
Seven-season weather notebook

What the snowfall record actually shows

These are recorded daily observations from the 2019–20 through 2025–26 seasons—not a forecast and not a promise. They are most useful for comparing the shape of the season.

Average snow by month

Nov
12.7"
Dec
26.4"
Jan
34.1"
Feb
29.3"
Mar
24.6"
Apr
18.4"

January recorded the highest recent monthly average. March was the swing month: as little as 3 inches and as much as 58.

Recent season totals

2019–20
173"
2020–21
118"
2021–22
103"
2022–23
169"
2023–24
171"
2024–25
163"
2025–26
145"
Recent 7-season avg.
148.9"
69-season avg.
171.1"

Partial temperature snapshot

Temperature records in the source are partial: January–May 2024 and October 2024–January 1, 2025. Treat them as a useful snapshot, not a climate normal.

MonthBase avg.Summit avg.Observed days
Nov40.0°F29.8°F27
Dec25.2°F17.1°F31
Jan21.5°F10.9°F23
Feb26.6°F15.9°F29
Mar32.9°F23.6°F29
Apr40.6°F27.2°F24

What the data can—and cannot—tell you

The source Sheet combines 69 completed annual snowfall totals from 1955–56 through 2023–24 with daily Sugarloaf-reported snowfall for 2019–20 through 2025–26. Monthly averages in this guide come from those seven recent daily logs. Dustings recorded as text are treated as zero inches, so the totals remain conservative and auditable.

This is not a forecast model. Resort snowfall measurement, wind redistribution, rain, grooming and terrain openings all affect skiing. The temperature tabs are partial snapshots rather than a climatological normal. Use the record to choose a travel window; use the current forecast and mountain report to choose a ski day.

January: the best all-around window

January produced the highest recent monthly average—34.1 inches—and the most measurable snow days at 9.3. Every one of the seven seasons logged at least 19 inches, and the best reached 49. By this point, snowmaking has had sustained cold and natural snow has begun to build the woods.

The cost is temperature. In the partial temperature record, the base averaged roughly 22°F in January and the summit about 12°F. A cold northwest wind can make that difference feel much larger. January favors skiers who dress well, start early and accept that upper lifts may be the day's variable.

February: the powder planner's choice

February averaged 29.3 inches, but its median was higher at 34 inches. Five of seven seasons landed between 23 and 44 inches; one seven-inch February pulled down the mean. That makes February the strongest choice when your goal is accumulated base plus repeated chances for a refresh.

It is also vacation season. Fresh snow does not guarantee empty trails, and wind can move traffic onto fewer lifts. If your dates are flexible, favor non-holiday weekdays and keep the arrival day clear enough to adjust around a storm.

March: the highest upside and widest spread

Recent March totals range from 3 to 58 inches. That is the month in one line. A cold pattern can deliver the season's best natural terrain; a warm storm followed by refreeze can turn the same map into a firm groomer day.

The partial temperature sample puts the base near 33°F and the summit near 24°F on average. Timing becomes a skill: follow the sun, let frozen surfaces soften and stop skiing an aspect when it becomes heavy or scraped. March rewards travelers who can adjust their expectations by the hour.

December and April: book for the right reasons

December averaged 26.4 inches in the recent log, but natural-terrain coverage is still developing. It is a good month for groomers, snowmaking and holiday atmosphere—not the safest bet for Brackett Basin or every glade on the map.

April averaged a surprising 18.4 inches and produced a 43.5-inch outlier in 2019–20. Yet April decisions are governed by freeze-thaw cycles, operating schedules and overnight temperatures. Book it for sunshine, soft corn snow and a relaxed pace. Treat a powder day as a gift.

The long record is a reminder about variability

Across 69 completed historical seasons, the Sheet's average is 171.1 inches. The snowiest listed season, 1995–96, reached 389 inches; the leanest, 1964–65, recorded 77. The median of the seven recent seasons is 163 inches even though the recent average is only 148.9, showing how the 103- and 118-inch seasons pull the mean down.

That spread is why a single annual average should never be read as a promise. Snow can arrive early or late, in many small events or two large storms. Terrain quality depends on when it falls and what the temperature does next.

How to use a seven-day forecast

Start with summit wind

A pleasant base forecast does not tell you whether exposed upper lifts will run comfortably.

Watch the temperature after precipitation

Rain followed by rapid cooling is often more consequential than the precipitation total.

Separate new snow from base depth

Six inches on thin woods is not the same trip as six inches over a mature February base.

Read the morning report

Scheduled lifts, grooming, patrol work and delayed openings convert weather into the terrain you can actually ski.

Keep one flexible day

On a multi-day trip, use the worst-weather window for arrival, rest or a lower-elevation activity when possible.

Our pick

For the best balance of coverage, snowfall frequency and manageable daylight, target late January through the first non-holiday weeks of March. Then let the forecast choose the exact days.

Practical answers

Frequently asked questions

What month gets the most snow at Sugarloaf?

In the seven recent daily logs analyzed here, January has the highest average at 34.1 inches. February has a 34-inch median and is nearly as strong.

Is March a good time to ski Sugarloaf?

Yes, but it is volatile. Recent March totals range from 3 to 58 inches, and freeze-thaw timing can matter more than the total.

How much snow does Sugarloaf average?

The user's historical Sheet averages 171.1 inches across 69 completed seasons from 1955–56 through 2023–24. Sugarloaf currently publishes a 200-inch annual average; measurement periods and methods may differ.

When are Sugarloaf's glades most likely to be open?

Midwinter through March usually offers the best base-building window, but openings depend on actual coverage, patrol assessment and current conditions rather than the calendar.

Planning notes & sources

Mountain operations, hours and trail status change. We use official resort pages for current facts and local discussions for lived context; always verify the day's report before leaving.

Keep planning

Related Sugarloaf guides